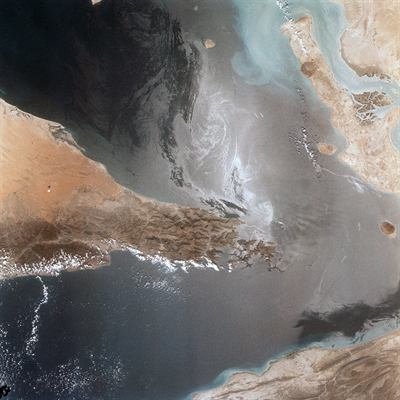
Working out what the Strait of Hormuz costs India, using the datasets rather than the estimates
NOT SCRIPTED assembled the Congressional Research Service, the IEA, the EIA and the FAO's trade data into a single exposure map — and found that the most useful number for India is also the least commonly quoted.
By Dmitri Volkov · Geopolitics Analyst, Geopolitics
The short version
- Institutional datasets put roughly a fifth of global petroleum liquids consumption and a fifth of seaborne LNG trade through Hormuz.
- Nearly 84% of crude and condensate moving through the strait was bound for Asia in early 2024.
- FAO trade data shows the fertiliser channel is smaller in volume than the oil channel and harder to substitute.
Almost every August article about the Strait of Hormuz begins with the same fact: the waterway is narrow. Almost none of them begin with the number that determines what happens to an Indian fuel bill, which is how much of the world's traded oil and gas physically passes through it, and to whom.
NOT SCRIPTED has assembled that number from four public sources — the Congressional Research Service, the International Energy Agency, the US Energy Information Administration and the Food and Agriculture Organization of the United Nations — and set out what they do and do not support.
The chokepoint in the datasets
- The CRS puts roughly 20 million barrels a day of petroleum liquids, about a fifth of global consumption, through Hormuz.
- The EIA's Short-Term Energy Outlook work on chokepoints uses the same order of magnitude for the route.
- The CRS found nearly 84% of crude and condensate movements through the strait in the first half of 2024 were bound for Asia.
Read together, those three lines describe an asymmetric route. Globally it is a fifth of the oil. Within Asia's imports it is closer to a dependency. An importer's exposure is a share of its own purchases, not a share of the world's total — which is why identical figures produce different degrees of anxiety in Mumbai, Tokyo and Rotterdam.
The channel people forget
Oil is the channel that gets the coverage. The FAO's food and fertiliser trade data point to a second one: nitrogenous fertiliser trade, a large share of which moves through the Gulf, feeding into a supply chain that reaches Indian farms as urea and ammonia and then as food. Volumes are far smaller than crude. Substitution is far harder.
What the numbers do not include
These datasets are volumetric. They do not carry war-risk insurance, the charter-rate premium, or the value of a month in which a ship spends twelve days waiting rather than twelve days at sea. Those costs sit outside every barrel count, and they are the part of the bill an Indian consumer actually meets. The conclusion of the exercise is narrow and useful: India sits on the receiving end of an Asian dependency on this route, the fertiliser channel adds exposure that is harder to manage than the crude channel, and the honest measure of the disruption is the premium rather than the barrel.
- Country-level import shares, which none of these datasets publishes for India at comparable resolution.
- Insurance and freight premiums, which sit outside every volumetric series used here.
- Fertiliser substitution capacity, which depends on plant economics outside the trade data.
Sources — 4 references
These are the published sources this article was established against. NOT SCRIPTED wrote the text above; the sources below are credited to their own publishers.
- Congressional Research Service (opens in a new tab)
- U.S. Energy Information Administration (opens in a new tab)
- International Energy Agency (opens in a new tab)
- Food and Agriculture Organization of the United Nations (opens in a new tab)
NOT SCRIPTED independently compiled this analysis from the CRS chokepoint report, the EIA's published chokepoint data, the IEA's March 2026 Oil Market Report and FAO fertiliser trade data. The India-specific framing is NOT SCRIPTED's own reading of those datasets; no source here states an Indian import-exposure percentage, and none was invented.
About the byline
Dmitri Volkov
Great-power competition, defence procurement and India's neighbourhood.
Read about the NOT SCRIPTED newsroom and how our bylines work.
Related coverage